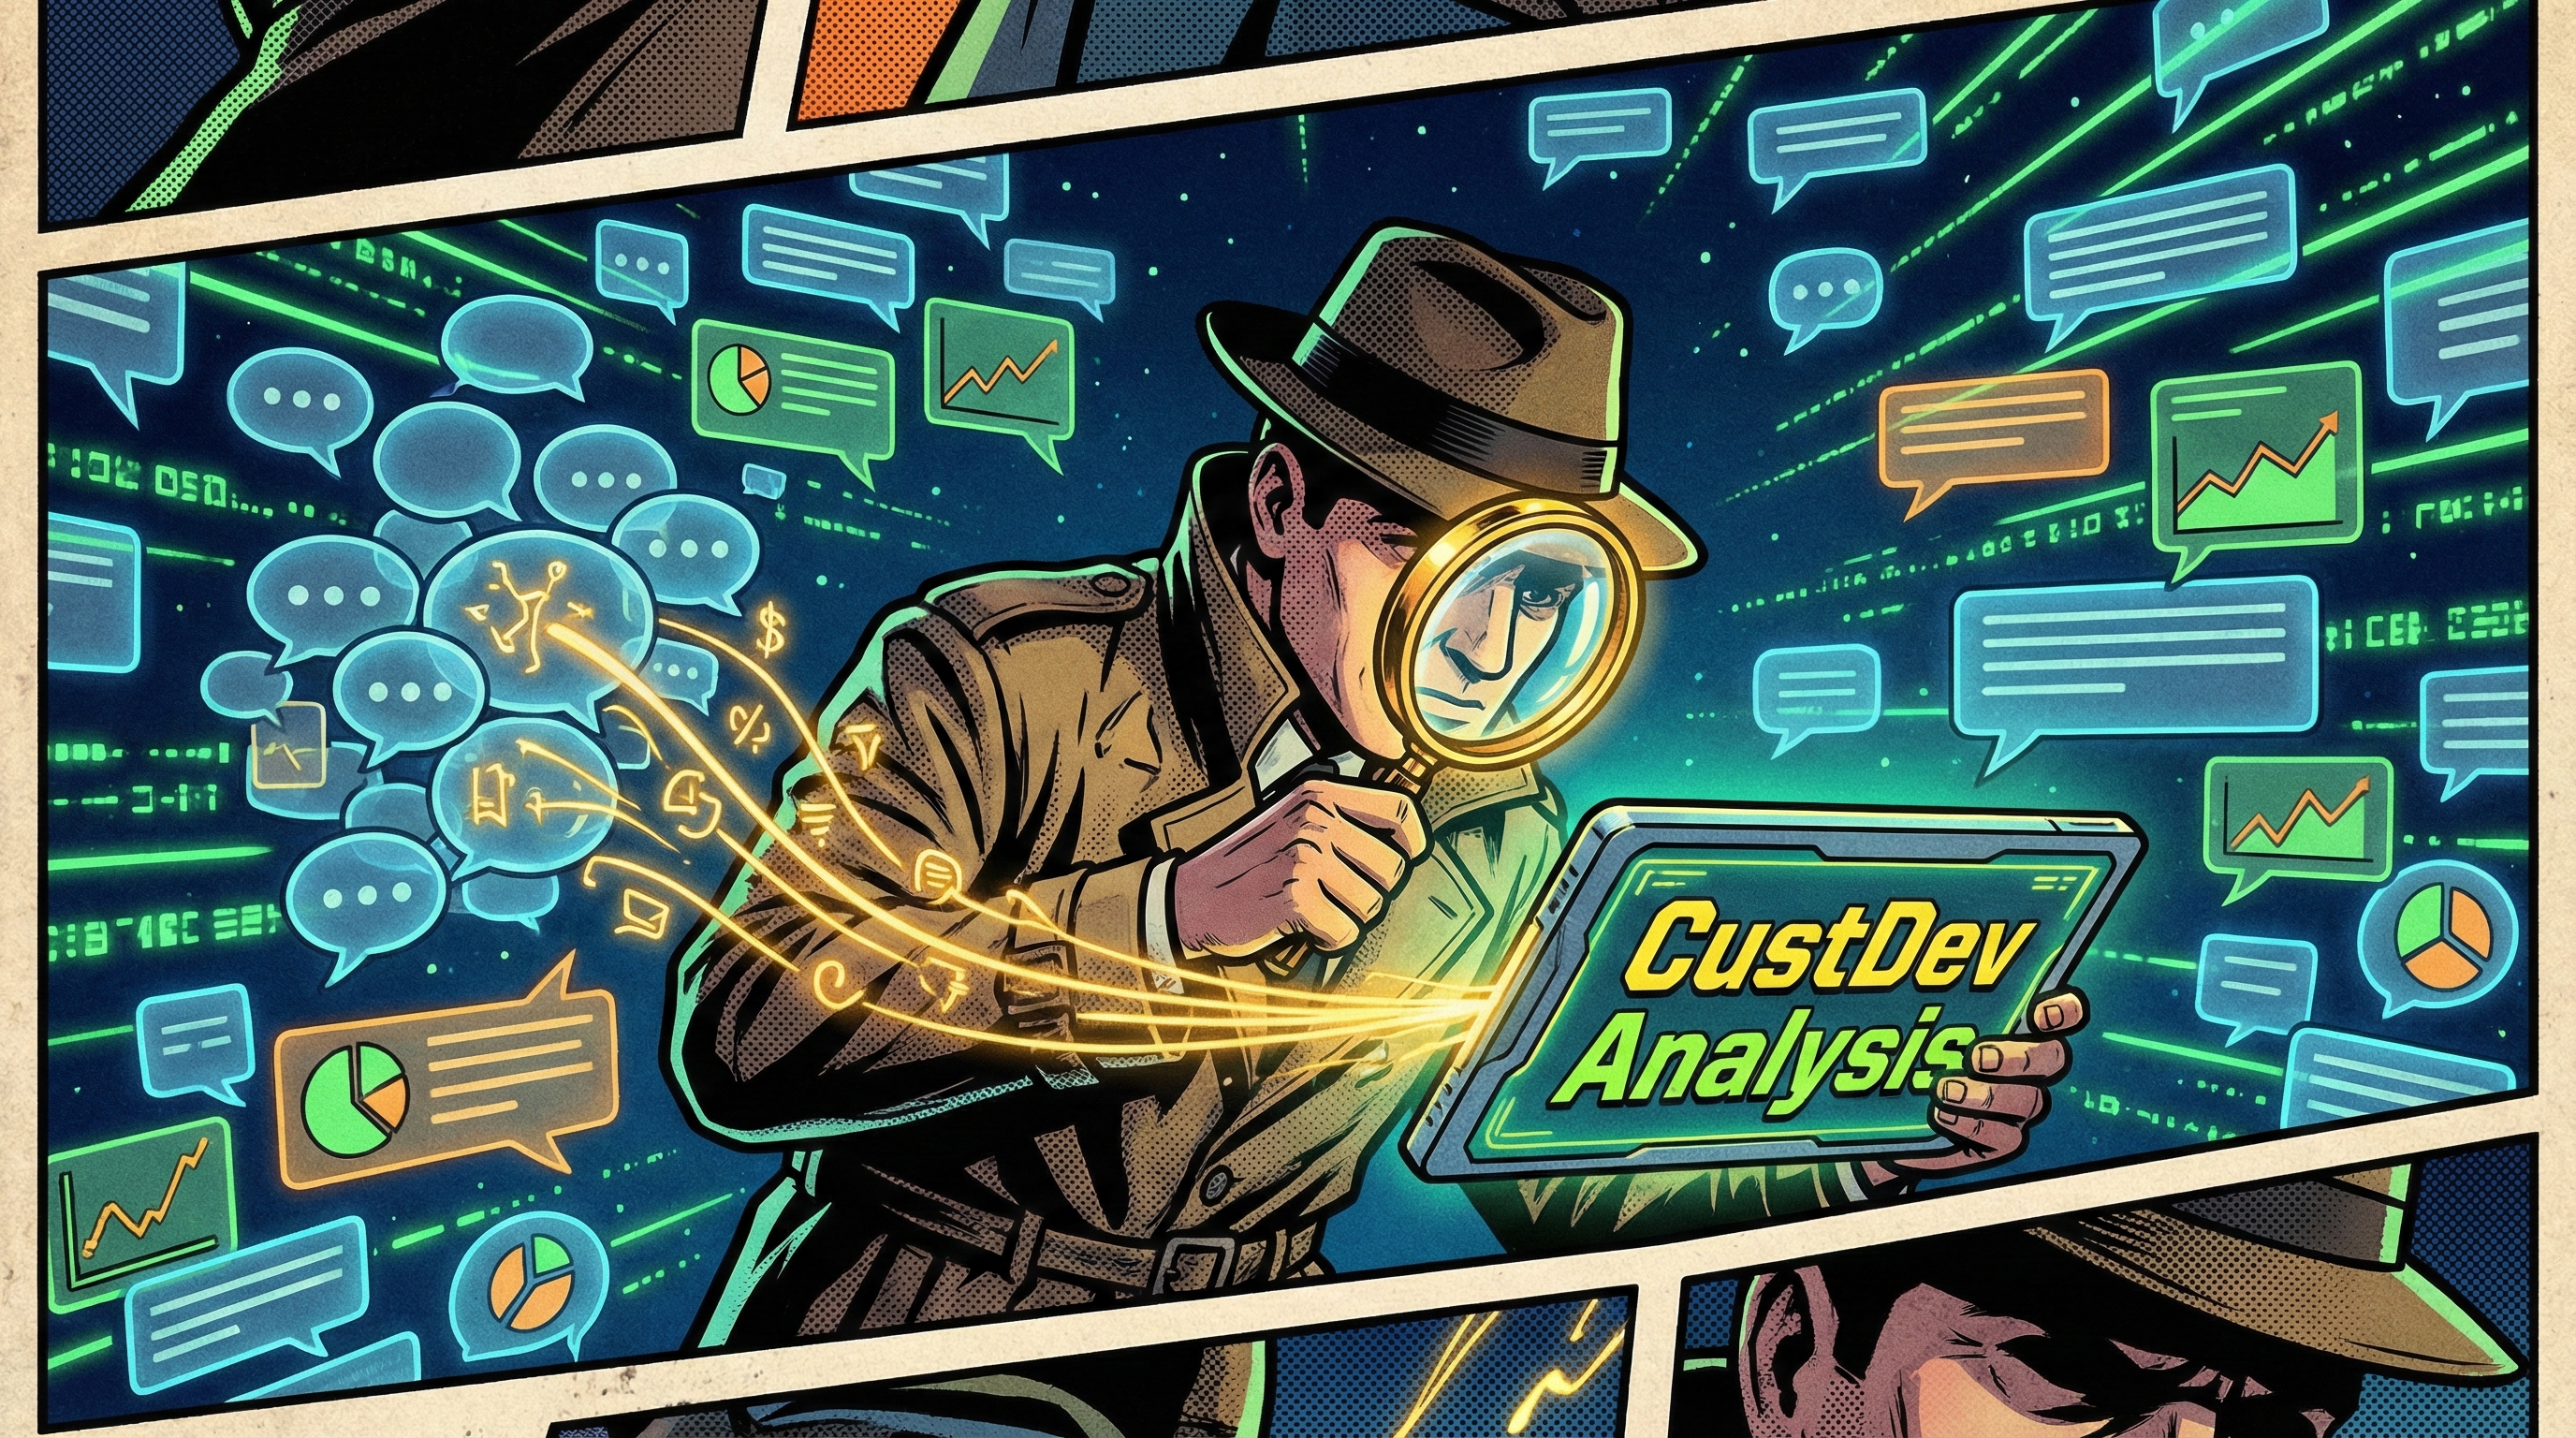
1. Introduction: Why CustDev on Chat Data Is the Next Level
Traditional Customer Development, as defined by Steve Blank's methodology, involves conducting in-depth interviews with potential customers. A typical startup conducts 20–50 interviews, each lasting 30–60 minutes. This yields quality insights — but suffers from fundamental limitations that can no longer be ignored in 2026.
Imagine: you're building a product for video production agencies. You conducted 25 interviews, spent 3 weeks and $5,000. Respondents politely nodded: "Yes, that would be great!", "Of course, we'd pay for that!" You launched your MVP — and silence. Zero sales. What went wrong?
What went wrong is that people in interviews lie. Not maliciously — it's simply how human psychology works. This is called Social Desirability Bias, and research by Bergen & Labonté (2020) convincingly demonstrates that respondents systematically skew their answers toward socially desirable responses.
Now imagine a different scenario. You take 142,000 messages from 271 topical Telegram channels. You run an LLM analysis for $0.01. Within an hour, you have — quantitatively validated pain points, real quotes, monthly trends, and a competitor map. Without a single interview. Without bias. With a sample three orders of magnitude larger.
This is not science fiction. This is Passive CustDev — a Customer Development method based on analyzing existing data from chats, forums, and communities, without direct contact with respondents. And in this article, we'll show how it works from start to finish.
What Is Passive CustDev?
We introduce the term Passive CustDev — it's not a replacement for interviews, but a powerful additional layer of validation that:
2. Advantages Over Traditional Interviews
Social Desirability Bias: Why Respondents Lie
In the CustDev context, social desirability manifests as follows: respondents downplay problems ("well, it's not that bad"), exaggerate willingness to pay ("$50/month? Sure, no problem"), and adjust to the interviewer's expectations. In anonymous chats and communities, this effect is significantly reduced. People write in chats not for a researcher, but to solve their real problem. They don't know they'll be analyzed, so their words are raw truth.
Scale: Thousands vs Dozens
20 interviews is the standard "until saturation" in qualitative research. But a single Telegram community generates 5,000–50,000 messages per month. Chat analysis allows working with a sample 2–3 orders of magnitude larger, providing statistical significance, detection of rare but critical patterns (long tail), behavioral segmentation, and dynamics over time.
Context: "Here and Now" vs Recollections
Interviews rely on retrospective memory — the person recalls what they did and felt. This is inevitably distorted (recall bias). In chats, we see the "here and now" moment:
- "Damn, the export broke again, wasted 3 hours!" — real pain in real time
- "Does anyone know how to do X through Y?" — a real task (job)
- "Switched to Z, finally works properly" — real switching behaviour
Comparison Table
| Parameter | Traditional CustDev | Passive CustDev (Chats) |
|---|---|---|
| Sample size | 20–50 people | 1,000–100,000+ messages |
| Collection time | 2–6 weeks | Hours (if data exists) |
| Social desirability bias | High | Minimal |
| Recall bias | High | Absent |
| Cost | $2,000–10,000+ | $0.01–5 |
| Follow-up questions | ✅ Yes | ❌ No |
| Insight depth | Very high | Medium–high |
| Quantitative validation | ❌ No | ✅ Yes |
| Reproducibility | Low | High |
The cost of LLM analysis of 5,000 messages on DeepSeek V3.2 is $0.014. Even on Claude Sonnet 4.5 — just $1.50. Compare that with $5,000+ for a series of interviews. A 1000× difference.
3. Step-by-Step Framework: 6 Stages
Stage 1: Defining Research Questions
Before collecting data, you need to formulate specific questions. Without clear questions, the analysis becomes a "fishing expedition" — you'll find anything, but won't understand what's important.
Stage 2: Data Collection
Not all chats are equally useful. Topical professional groups where people discuss work problems — a gold mine. Support and help groups with questions like "how do I do X?" and "why isn't Y working?" — excellent. Competitor chats — feedback on existing solutions. But spam groups and off-topic chats — that's noise without signal.
Typical noise categories that need to be filtered out:
- Greetings and goodbyes — "Hi everyone!", "Thanks, bye!"
- Meta-discussions — chat rules discussions, moderation
- Off-topic — memes, politics, weather
- Bot messages — auto-posts, advertising spam
- Technical noise — "+1", "bump", links without context
Recommended filters: minimum message length of 30+ characters (cuts out one-word replies), whitelist of domain-specific terms, bot exclusion by user_id or message pattern, time filter — typically the last 3–12 months.
Stage 3: Data Coding
Coding is the process of assigning categories (codes) to text fragments. This is the central stage of the entire analysis. It proceeds in three phases:
Open Coding — the first pass through data without predefined categories. We read messages and tag everything we see:
Message: "This is the third time I've tried to set up automatic
mailings, and there's some error every time. Support has been
silent for a week."

Codes:
- pain:setup_complexity (setup difficulty)
- pain:reliability (unreliability)
- pain:support_response_time (support response time)
- emotion:frustration (frustration)
- frequency:recurring (recurring problem)
Axial Coding — grouping open codes into categories. For example, pain:setup_complexity, pain:documentation_poor, and pain:learning_curve combine into the category "Onboarding Problems."
Selective Coding — identifying the core category — the main "story" the data tells.
Stage 4: Quantitative Analysis
After coding, we move to counting. Frequency analysis: how many times each pain point is mentioned, what percentage of users face problem X, how problems are distributed across categories. Trend analysis: is the mention of a problem growing over the last N months, is there seasonality, correlation with external events. Co-occurrence analysis: which problems are mentioned together — "those who complain about X usually also complain about Y."
Stage 5: Qualitative Analysis
Quantitative data shows "what" and "how much," qualitative data shows "why" and "how." At this stage, we conduct:
Verbatim Analysis — selecting the most illustrative quotes for each category. A good quote describes a specific situation, contains an emotional marker, indicates a workaround attempt, and mentions a competitor or alternative.
Emotion Analysis — searching for linguistic markers: frustration ("third time already," "again," "impossible," "fed up"), urgency ("urgent," "deadline," "ASAP"), willingness to pay ("I'd pay for a proper solution"), switching ("left X for Y," "stopped using").
Contextual Analysis — in what context does the problem arise, who is asking (role, experience level), what came before and after the message in the thread.
Stage 6: Triangulation
One data source is a hypothesis. Three sources are an insight.
4. Frameworks: JTBD, Pain-Gain Mapping, Thematic Analysis
4.1. JTBD (Jobs to Be Done) on Chat Data
Clayton Christensen's (Harvard, 2005) and Tony Ulwick's framework defines that customers "hire" a product to get a "job" done. The job statement formula:
When [situation], I want to [motivation], so I can [expected outcome].
How to extract JTBD from chats:
- "How do I do X?" pattern — a direct job expression. "How do I quickly edit a video for Instagram?" → Job: quick editing for social media
- "I need X for Y" pattern — job + context. "Need a CRM for a 5-person agency so we don't lose clients" → Job: client base management for a small team
- "Used to do X, now need Y" pattern — job evolution. "Excel used to be enough, but with 50 clients it's a nightmare" → Job: scaling processes
- "Switched from X to Y because Z" pattern — switching trigger. "Left Bitrix for Notion because the interface was impossible" → Job: simple interface for team collaboration
Job Map from chat data — at each stage of the customer's "job," you can find characteristic message patterns:
| Stage | What to look for in chats | Example |
|---|---|---|
| Define | "I want to do X" | "I want to launch a newsletter to my list" |
| Locate | "Where can I find X?" | "Can anyone recommend an email marketing service?" |
| Prepare | "How do I set up X?" | "How do I import my list into Mailchimp?" |
| Confirm | "Am I doing this right?" | "Is it correct that I need to verify my domain?" |
| Execute | Problems during execution | "Newsletter sent, but 30% bounced" |
| Monitor | "How do I check the result?" | "Where can I see the open rate?" |
| Modify | "How do I improve?" | "How do I increase email conversion?" |
| Conclude | Result evaluation | "2% conversion — is that normal?" |
4.2. Pain-Gain Mapping
A structured approach to mapping customer pains and gains. Each pain is classified along four dimensions:
Similarly, desired gains are mapped: functional ("I want it to work automatically"), emotional ("I want to sleep peacefully"), financial ("I want to save $X per month"), and time-related ("I want to spend 10 minutes on this, not 3 hours").
4.3. Thematic Analysis (Braun & Clarke, 2006)
The six phases of thematic analysis — the gold standard of qualitative research, updated by the authors in 2019 as reflexive thematic analysis:
Phase 1: Familiarization with the Data. Read a significant portion of messages. Record first impressions. For large volumes — a random sample of 500–1,000 messages.
Phase 2: Generating Initial Codes. Systematic coding of all relevant fragments. A single fragment can have multiple codes. Preserve context (surrounding messages).
Phase 3: Searching for Themes. Grouping codes into potential themes. Creating a thematic map. Identifying main themes and sub-themes.
Phase 4: Reviewing Themes. Verification: does all data "fit" the theme? Merging overly granular themes, splitting overly broad ones. Test: can the theme be described in one sentence?
Phase 5: Defining and Naming Themes. Clear formulation of each theme. Defining the "story" each theme tells. Linking the theme to the research question.
Phase 6: Writing Up. Structured presentation with quotes. Analytical narrative (not just description, but interpretation). Connection to business goals and product decisions.
4.4. Affinity Diagramming
A bottom-up method for grouping insights: each coded message is one "card." Group cards by similarity without predefined categories, name each group, group the groups into meta-categories, and build a hierarchy of problems. When working with thousands of messages, Affinity Diagramming is performed on a subsample (100–300 of the most substantive messages) or automated through clustering: embeddings → UMAP → HDBSCAN.
5. AI Tools for Analysis
5.1. NLP Classification
Sentiment Analysis determines the emotional tone of a message. For Russian language: models based on RuBERT, DeepPavlov, or LLM classification. Important nuance: sentiment ≠ pain point. "Great service, but the newsletters don't work" — positive sentiment, but there's a problem.
Intent Classification determines intent: question, complaint, recommendation, feature request, comparison, review. Enables quick filtering of messages with problems.
Topic Modeling. BERTopic + sentence-transformers — state-of-the-art for topic modeling in 2025–2026. For Russian language: multilingual sentence-transformers (paraphrase-multilingual-MiniLM-L12-v2). Modern approach: embedding → clustering → LLM-labeling.
Named Entity Recognition (NER) extracts mentions of competitors, products, prices, and deadlines. Enables automatic construction of a "competitor map" from chats.
5.2. Manual vs Automated Coding
| Approach | Pros | Cons | When to use |
|---|---|---|---|
| Manual | High accuracy, context understanding, nuance | Slow (50–100 msg/hour), expensive | Pilot (200–500 msg), validation |
| LLM | Fast (thousands in minutes), reproducible | Misses context, hallucinations | Mass processing after calibration |
| Hybrid | Balance of accuracy and speed | More complex to set up | Production research |
Recommended hybrid approach:
- Manual coding of 200–500 messages → creating a codebook
- Calibrating the LLM prompt against manual data → checking agreement (≥80%)
- LLM coding of the entire dataset
- Manual review of a sample (10–20%) → iterating the prompt if needed
- Final manual analysis of top-level themes
5.3. Prompt Engineering for CustDev Analysis
Prompt for message classification:
You are a product research analyst. Analyze this message
from a Telegram chat and determine:

1. INTENT: question | complaint | feature_request | recommendation |
   comparison | review | irrelevant
2. PAIN_POINTS: list of problems, each in format
   [category:description]
3. JOBS: what is the user trying to do?
   (When..., I want to..., so I can...)
4. COMPETITORS: mentioned competitors/products
5. EMOTION: neutral | frustration | excitement | disappointment |
   urgency
6. SEVERITY: 1-5 (how critical is the problem)

Message: "{message}"
Chat context: {chat_name}

Respond in JSON format.
Prompt for batch thematic analysis:
Analyze the following {N} messages from chat "{chat_name}":

1. TOP-10 themes — what people talk about most
2. TOP-10 pain points — what problems they face
3. TOP-5 feature requests — what they want
4. For each: number of mentions, example quotes (verbatim)

Format: JSON with arrays themes[], pains[], requests[]
Prompt for JTBD extraction:
From the following messages, extract all Jobs to Be Done.
Format: "When [situation], I want to [motivation], so I can [outcome]"

Rules:
- Extract only explicitly stated or easily inferred jobs
- Do not invent jobs that aren't in the text
- Group similar jobs
- Indicate the number of messages supporting each job
5.4. Prompt Engineering Principles for CustDev
5.5. Tool Stack
| Model (February 2026) | Input $/1M tok | Output $/1M tok | Use case |
|---|---|---|---|
| DeepSeek V3.2 | $0.028 | $0.28 | Mass classification, best $/quality ratio |
| Gemini 3 Flash | $0.075 | $0.30 | Fast batch processing |
| GLM-5/Pony | $0.11 | $0.11 | Budget alternative for Russian language |
| Claude Sonnet 4.5 | $3.00 | $15.00 | Complex qualitative analysis, nuance |
For visualization: Matplotlib/Plotly for trend charts, UMAP + cluster visualization for thematic maps, word clouds for quick visual representation. For storage: SQLite + FTS5 for full-text search across messages, Python (pandas, numpy) for statistical analysis, BERTopic for automatic topic modeling.
6. Metrics: Pain Severity Score and Urgency Indicators
6.1. Pain Severity Scoring
The main metric of Passive CustDev is the Pain Severity Score (PSS). It's a numerical indicator of problem severity, calculated from four parameters:
PSS = F × I × W × U
Where F = Frequency, I = Intensity, W = Willingness to Pay, U = Urgency. Each parameter ranges from 1 to 5. Maximum: 625.
| Parameter | 1 | 2 | 3 | 4 | 5 |
|---|---|---|---|---|---|
| F (Frequency) | Isolated (<5) | Rare (5–20) | Regular (20–50) | Frequent (50–100) | Massive (100+) |
| I (Intensity) | Neutral | Mild frustration | Noticeable | Strong emotion | Extreme (churn) |
| W (Willingness) | Not mentioned | Nice to have | Need | Willing to pay | Will pay anything |
| U (Urgency) | Someday | Months | Weeks | Days | On fire now |
PSS Interpretation:
6.2. Urgency Indicators
Linguistic urgency markers are one of the most informative signals in chats:
| Level | Markers | Chat example |
|---|---|---|
| 🟢 Low | "would be cool," "someday," "I dream of" | "It would be cool if there was auto-export" |
| 🟡 Medium | "need," "looking for a solution," "anyone know" | "Anyone know a good service for X?" |
| 🟠 High | "urgent," "on fire," "can't work" | "Urgent: client is waiting" |
| 🔴 Critical | "HELP," caps lock, !!! | "Everything broke, NOTHING WORKS!!!" |
6.3. Competitor Mentions Analysis
For each mentioned competitor, we record: total number of mentions and context — recommendation (X%), comparison (Y%), criticism (Z%), neutral (W%). We separately identify switching triggers (why they leave) and switching barriers (why they stay). This provides a complete map of the competitive landscape.
6.4. Price Sensitivity Analysis
Price sensitivity indicators from chats:
- Direct price mentions: "X costs $50/month — that's expensive"
- Comparisons: "Y is cheaper but worse" → price threshold
- Free alternatives: "Why pay when there's a free Z?"
- ROI calculations: "If it saves me 10 hours/month, then $30 is fair"
- Discount requests: "Any promo codes?", "When's the sale?"
6.5. Required Research Metadata
Every CustDev report based on chat data must contain metadata. Without it, the report is an opinion, not research:
📊 RESEARCH METADATA
━━━━━━━━━━━━━━━━━━━━━━━━━━
Data period: [start_date] — [end_date]
Sources: [list of chats/channels with subscriber counts]
Sample size: [N total messages] → [M after filtering]
Filters: [what was removed and why]
Coding method: [manual / LLM / hybrid]
LLM model: [if used]
Inter-rater reliability: [if checked]
Limitations: [honest list]
7. Report Template
A ready-to-use CustDev report template based on chat data, applicable to any niche:
# CustDev Report: [Topic/Niche]

## Executive Summary
[3-5 sentences: key findings, opportunity size,
recommendation]

## Methodology
- Sources: [N channels, M total subscribers]
- Period: [dates]
- Volume: [X messages → Y after filtering]
- Method: [description]

## Key Findings

### Pain Points (Top 10)
| # | Pain Point | PSS | Mentions | Example Quote |
|---|---|---|---|---|
| 1 | ...        | 450 | 234      | "..."         |

### Jobs to Be Done (Top 5)
1. When [situation], I want to [motivation],
   so I can [outcome]
   - Evidence: N messages, M channels
   - Existing solutions: [what they currently use]

### Competitor Landscape
[Competitor map with analysis]

### Price Sensitivity
[Price expectation analysis]

## User Segments
[Identified segments with characteristics]

## Recommendations
1. [Specific recommendation with rationale]

## Limitations
[Honest list of limitations]

## Appendices
- Complete codebook
- Table of all coded messages
- Trend charts
Good Insights vs Bad Insights
"Many users complain about video quality." No quantitative data, no specifics, no quotes, no PSS. This is not an insight — it's an impression.
"127 out of 3,400 analyzed messages (3.7%) across 8 out of 15 channels contain complaints about video quality loss when exporting to MP4 for Instagram Reels. PSS = 340/625. Typical quote: 'I edit in 4K, export for Reels — and get mush. I've tried every setting, wasting an hour each time picking the right bitrate.' (channel @videoproduction_chat, Dec 2025). 23% of those complaining mention willingness to pay for a tool with presets."
8. Limitations and Ethics
8.1. Self-Selection Bias
Who writes in chats? Not a random sample of the population. These are active users (not the "silent majority"), technically literate (since they found a Telegram chat), experiencing a problem (happy customers stay silent), and a specific demographic profile. Chat data overestimates problems and underestimates satisfaction. This is normal for CustDev — we're specifically interested in problems. But it needs to be remembered when estimating market size.
8.2. Lack of Follow-Up Questions
In an interview, you can ask: "Why is this a problem for you?", "How often does this happen?", "How much would you pay?" In chats — you can't. We work with what's available. This limits the depth of individual insights, but is compensated by data volume. Partial solution: searching for "natural follow-ups" — when other chat participants ask clarifying questions, creating threads with deep discussions.
8.3. Lost Context
- Unanswered messages — unclear whether the problem was resolved
- Deleted messages — part of the discussion is lost
- Private discussions — some conversations move to direct messages
- Multimedia — screenshots and videos contain key information but aren't indexed by text search
8.4. Red Flags in Analysis
8.5. Ethical Considerations
Privacy: people did not consent to being studied. Never publish usernames without anonymization. Platform rules: check the ToS and community guidelines. GDPR/Data Protection Laws: if the data contains personal information — compliance with legislation is required. Context: B2B chats are more "public" in nature than private messages.
8.6. Language Nuances
When working with Russian-language chats, consider: slang and abbreviations (colloquialisms that LLMs may not understand), irony and sarcasm ("Wonderful service, only waited 2 hours for a response" — that's a complaint, not praise), multilingualism (Russian-language chats frequently use English terms), and transliteration (outdated but still occurs).
9. Case Study: Analyzing 142K+ Telegram Messages
9.1. Data Description
We applied the described methodology to a real database — a collection of messages from Telegram channels and groups, assembled for conducting CustDev analysis across various niches.
9.2. How the Data Was Collected
- Channel identification: manual search + snowball sampling (from recommendations in chats)
- Parsing: Telethon/Pyrogram API for history export
- Storage: SQLite for compactness and portability
- Indexing: FTS5 for full-text search
- Updates: periodic additional parsing of new messages
9.3. Analysis Capabilities
Pain points by niche — full-text search by problem keywords:
SELECT * FROM messages_fts
WHERE messages_fts MATCH 'problem OR "not working" OR broken OR help'
ORDER BY rank;
Competitive analysis — competitor mentions with context:
SELECT * FROM messages_fts
WHERE messages_fts MATCH 'bitrix OR amocrm OR "my warehouse"'
ORDER BY date DESC;
Trends — mention dynamics by month:
SELECT strftime('%Y-%m', date) as month, COUNT(*)
FROM messages WHERE text LIKE '%keyword%'
GROUP BY month ORDER BY month;
Switching stories — stories of switching between products:
SELECT * FROM messages_fts
WHERE messages_fts MATCH 'switched OR migrated OR replaced OR moved'
Price mentions — price mentions and financial expectations:
SELECT * FROM messages_fts
WHERE messages_fts MATCH 'costs OR price OR expensive OR budget OR plan'
9.4. What Cannot Be Extracted
- Author demographics — Telegram doesn't show age, gender, or location
- Purchase history — what was actually bought after the discussion
- Deleted message context — if a message was deleted before parsing
- Media content — screenshots and videos are not indexed
- Private threads — discussions in DMs are inaccessible
9.5. Recommended Workflow
5,000 messages × ~100 tokens average = 500K input tokens. On DeepSeek V3.2: 500K × $0.028/1M = $0.014. Even on Claude Sonnet 4.5: $1.50. The technical cost of a full LLM analysis of one niche is $0.01 to $5.
10. Conclusion
CustDev on chat data is not a replacement for traditional interviews. It's a powerful complement that eliminates key limitations of the traditional approach and opens fundamentally new possibilities for product research.
What Passive CustDev Delivers
Critical Conditions
At the same time, obtaining reliable results critically depends on:
- Clearly understanding the limitations — self-selection bias, lack of follow-up, vocal minority
- Using rigorous methodology — Braun & Clarke thematic analysis, JTBD framework, PSS scoring
- Providing quantitative data — frequencies, PSS, trends, proportions
- Being honest in the report — metadata, limitations, counter-examples are mandatory
- Triangulating findings — one source is a hypothesis, three are an insight
The Future of Product Research
As LLMs evolve, analysis costs will only decrease while quality increases. Already today, DeepSeek V3.2 processes 5,000 messages for $0.014. In a year, that price will be even lower. We stand on the threshold of an era where any startup — even with zero research budget — can conduct a full CustDev on tens of thousands of messages from real communities.
Passive CustDev with a database of 142K+ messages and 271 channels is a ready-made infrastructure for conducting research across multiple niches at minimal cost. The framework described in this article gives you all the tools: from formulating questions to the final report.
Sources
- Blank, S. (2013). The Four Steps to the Epiphany. K&S Ranch.
- Braun, V., & Clarke, V. (2006). Using thematic analysis in psychology. Qualitative Research in Psychology, 3(2), 77-101.
- Braun, V., & Clarke, V. (2019). Reflecting on reflexive thematic analysis. Qualitative Research in Sport, Exercise and Health, 11(4), 589-597.
- Bergen, N., & Labonté, R. (2020). "Everything Is Perfect, and We Have No Problems": Detecting and Limiting Social Desirability Bias. Qualitative Health Research, 30(5), 783-792.
- Christensen, C. M. et al. (2016). Competing Against Luck: The Story of Innovation and Customer Choice. Harper Business.
- Ulwick, A. W. (2016). Jobs to be Done: Theory to Practice. Idea Bite Press.
- Salminen, J. et al. (2022). Detecting Pain Points from User-Generated Content. Working paper.
- EasyChair Preprint #13827 (2024). NLP Techniques for Pain Point Identification in Online Forums.
- ScienceDirect (2025). A comprehensive overview of topic modeling. Neurocomputing.
- ScienceDirect (2025). Harnessing the power of AI in qualitative research.